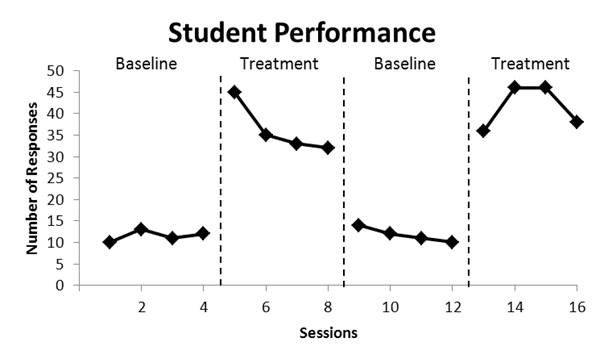


A reversal design graph is used to visualize data from a within-subject A-B-A experimental design. First, baseline data are collected before any treatment is provided (phase A). Next, the researcher presents the independent variable—usually some type of treatment or intervention—and records any changes in behavior (phase B). Lastly, the independent variable is removed and behavior is measured at the baseline again (phase A).
While this A-B-A experimental design is well-known, there are many variations (e.g., A-B-A-B or B-A-B) that allow for replication of the baseline and intervention. The A-B-A-B design, such as the graph above, allows for better experimental control and, therefore, is favored.
However, there are drawbacks to this design, such as irreversibility of behavior. If the treatment involves learning, it may be impossible to “unteach,” so behavior witnessed at the baseline cannot be reproduced in a second baseline. Also, in some instances, it may be unethical to withdraw treatment. For example, it may be dangerous and unethical to withdraw a client’s treatment that reduces self-injurious behavior.
Start making a reversal design graph!
Information source:
Cooper, J. O., Heron, T. E., & Heward, W. L. (2007). Applied behavioral analysis (2nd edition). Upper Saddle River, NJ: Pearson Education, Inc.