
Clinicians often use graphed data to evaluate the effectiveness of an intervention they are delivering to clients. Learning how to make graphs can be difficult. Published task analyses are a common way to learn how to create graphs. These articles list the steps one takes to make a graph. ACE Lab has been evaluating whether we can improve on this paradigm by incorporating video modeling. With advances in technology, services like YouTube have become resources for learning new skills. If you are having trouble changing something on your computer, simply go to YouTube and you can probably find a video of someone walking through how to fix the problem.
We have applied this to creating graphs. Instead of having a learner follow a written list of steps to create graphs, we created video models for each step. A video model is a brief video that demonstrates a target behavior. For graphing, this involves demonstrating how to set up and organize your data table, insert a graph, and format the graph according to APA and journal standards.
Thus far, our research demonstrates promising results. Video modeling appears to be a more effective instructional tool. The benefit is that a learner can see exactly where on the screen they should click, including buttons on toolbars and in pop-up menus. Compared to text –based instructions, video modeling produces more accurate graphing that takes less time to make.
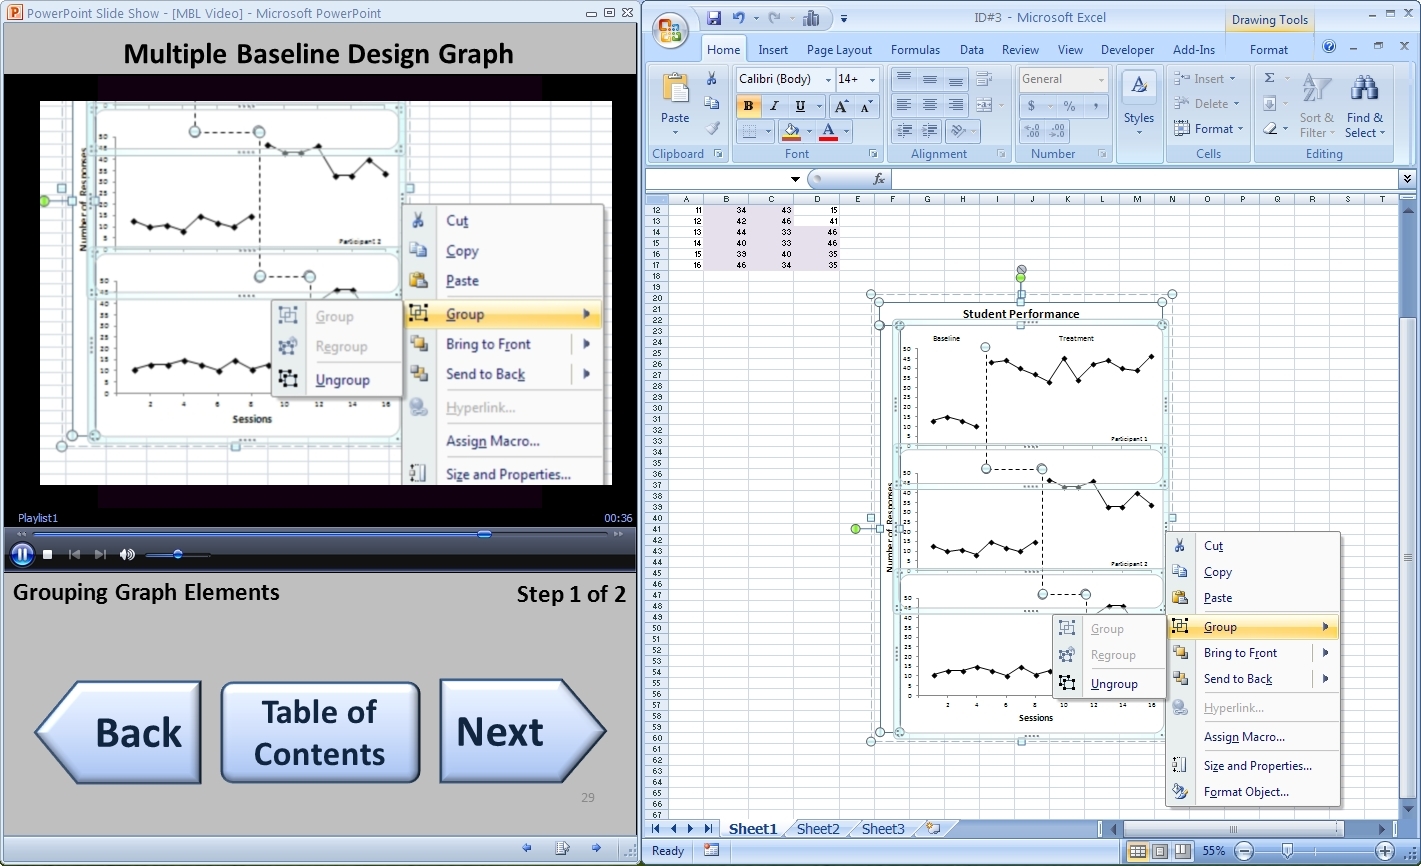
At the top of the page is a screen shot of how the video models can be used. We have a PowerPoint presentation on the left side of the screen. The presentation has embedded videos and buttons to move forward and backward through the process. On the right side of the screen, one can open Excel. This way, a learner can make a graph and complete a step while they see it happen in the video.
Use the video models by clicking here!